Cardiac Rehab Service Line Expansion: Adding Capacity Without Capital


Key Takeaways
Cardiac rehab has a long record of financial strain. In a 2009 costing study, the three traditional programs examined cost about $1,828 per patient against roughly $683 in Medicare-allowed charges, and nearly doubling the per-session payment in 2011 did not raise participation. Whether a program is profitable today depends on local costs, reimbursement, payer mix, and volume. Capacity has been a constraint too: a 2012 national survey estimated US programs could serve about 37% of eligible patients at maximum capacity. The business case rests on readmission penalty exposure, downstream service line activity, and program breadth. Systems can add capacity by building, extending an existing program (including with virtual sessions), or partnering.
Most vendor material on this subject implies that cardiac rehab is an underexploited profit center. Whether a particular program makes money depends on its local costs, reimbursement, payer mix, and volume, and no recent national study settles the question either way, so profit is a weak place to start a finance conversation. The more useful question is different: given that program-level economics have historically been difficult and capacity has been constrained, where does cardiac rehab actually create value for a health system, and what is the least capital-intensive way to capture it? The short answer: value comes mainly from readmission exposure, downstream activity, and program breadth rather than session margin, and capacity can be added by building, by extending an existing program, including with virtual sessions, or by partnering. The rest of this article sets out the evidence and how to choose.
Build, Extend, or Partner: Three Ways to Add Cardiac Rehab Capacity
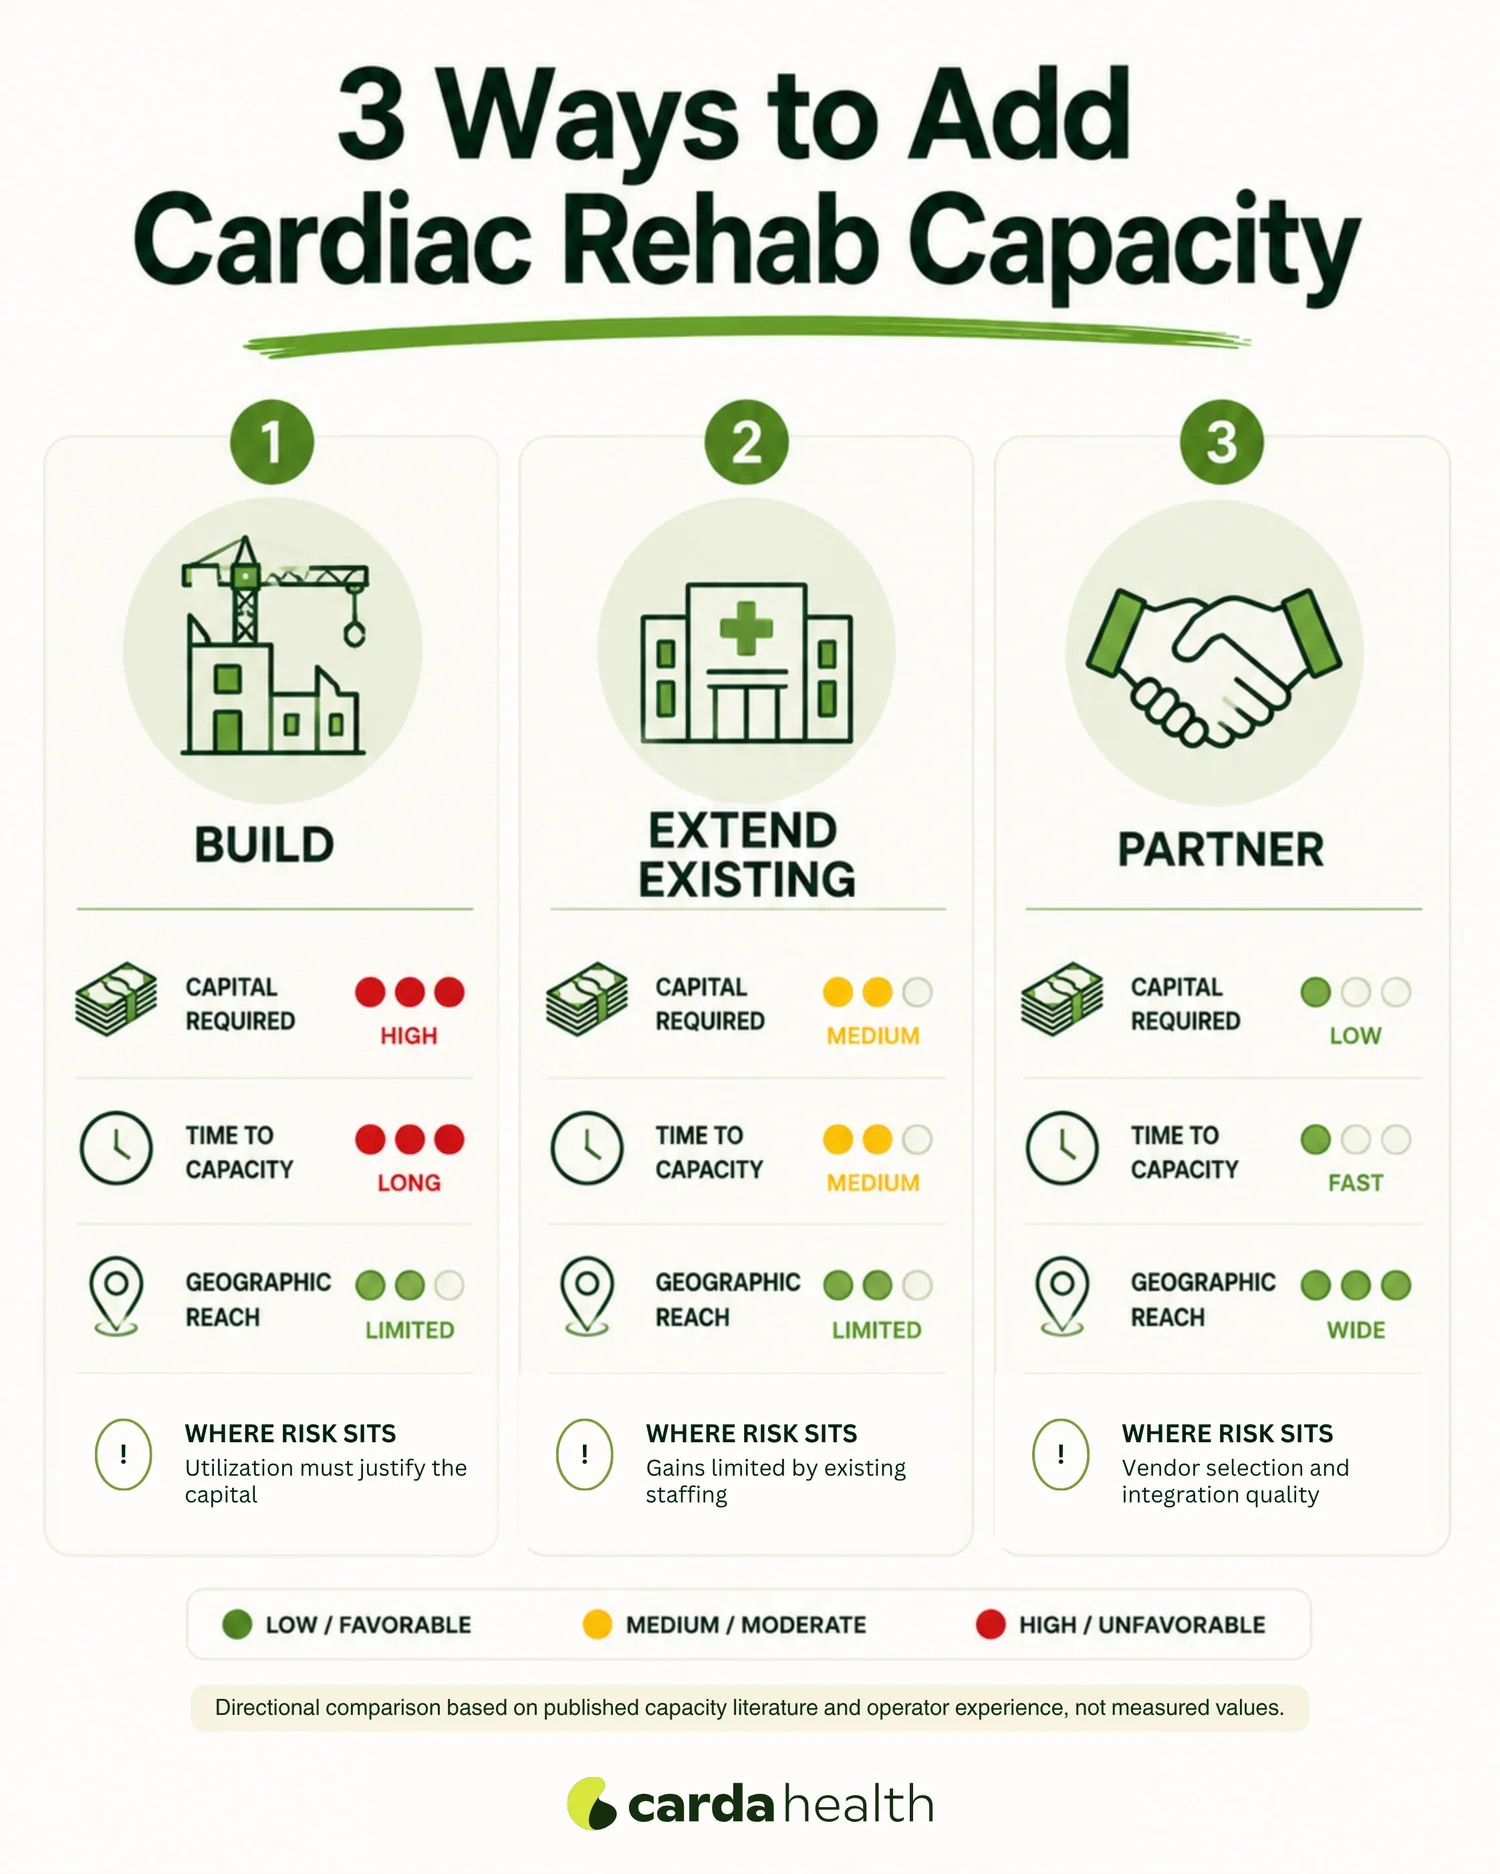
Broadly there are three routes, and they differ mainly in capital intensity and time to capacity. Which one fits depends on the economics, capacity limits, and value levers covered in the sections that follow.
| Build | Extend existing | Partner | |
|---|---|---|---|
| Capital required | Significant: space, equipment, build-out | Moderate: equipment and fit-out, lower for virtual sessions | Minimal |
| Staffing | Recruit and retain monitored staff | Extend existing staff, often already stretched | Provided by partner |
| Time to capacity | Longest | Medium | Shortest |
| Geographic reach | Limited to the site | Limited to the site, or patients' homes for virtual sessions through 2027 | Not constrained by site |
| Main risk | Utilization must justify the capital | Capacity gains are incremental | Vendor selection and integration quality |
This comparison is illustrative planning guidance drawn from published implementation experience. It is not measured performance data, and the right answer depends on your site, payer mix, and existing staffing.
The partnership route is not automatically correct. It trades capital risk for vendor and integration risk, which is a different risk rather than no risk, and our vendor evaluation guide sets out the criteria that separate partners.
The extend route now includes a virtual option, at least for now. The Consolidated Appropriations Act, 2026 allows hospital outpatient programs to deliver CR, ICR and PR to patients at home by real-time audio-video through December 31, 2027, so an existing program can add virtual sessions without new floor space. The provision expires unless Congress extends it, so model any virtual plan, whether run in-house or with a partner, both with and without it.
Our review of cardiac rehab delivery models compares the clinical trade-offs, and the reimbursement backdrop for virtual delivery is covered in our overview of telehealth cardiac rehab in 2026.
Cardiac Rehab Program Margins: What the Cost Data Show
Cardiac rehab has often been reimbursed below the cost of delivering it, though the picture varies by setting and vintage. A costing study published in 2009 and calibrated to seven US secondary prevention programs found that the three traditional cardiac rehab programs among them cost an average of $1,828 per patient, against Medicare-allowed charges of roughly $683, about $32.50 per session. In none of the seven programs did net revenues cover costs. It is old, but it remains the most recent multi-program costing study of US cardiac rehab, and no national study has measured since whether the gap it found has closed. A microcosting analysis at a single program compared a pre-pandemic period with the COVID-19 period and found the mean operating margin per participant moving from a surplus of $62 to a deficit of $421. Cost per participant rose 13% ($2,897 to $3,265), reimbursement fell 4% ($2,959 to $2,844), and monthly enrollment declined about 10%. None of those individual differences reached statistical significance. The swing reflects pandemic disruption to volume and staffing at one program and should not be read as a steady-state figure. Together, these studies show a history of financial strain, not a measured picture of program margins today.
Payment structure compounds this. Since 2018, services at non-excepted off-campus hospital departments have been paid at 40% of the OPPS rate, a 60% reduction against hospital outpatient rates, and inpatient cardiac rehab is not separately reimbursed at all, having been bundled into the DRG since the 1980s.
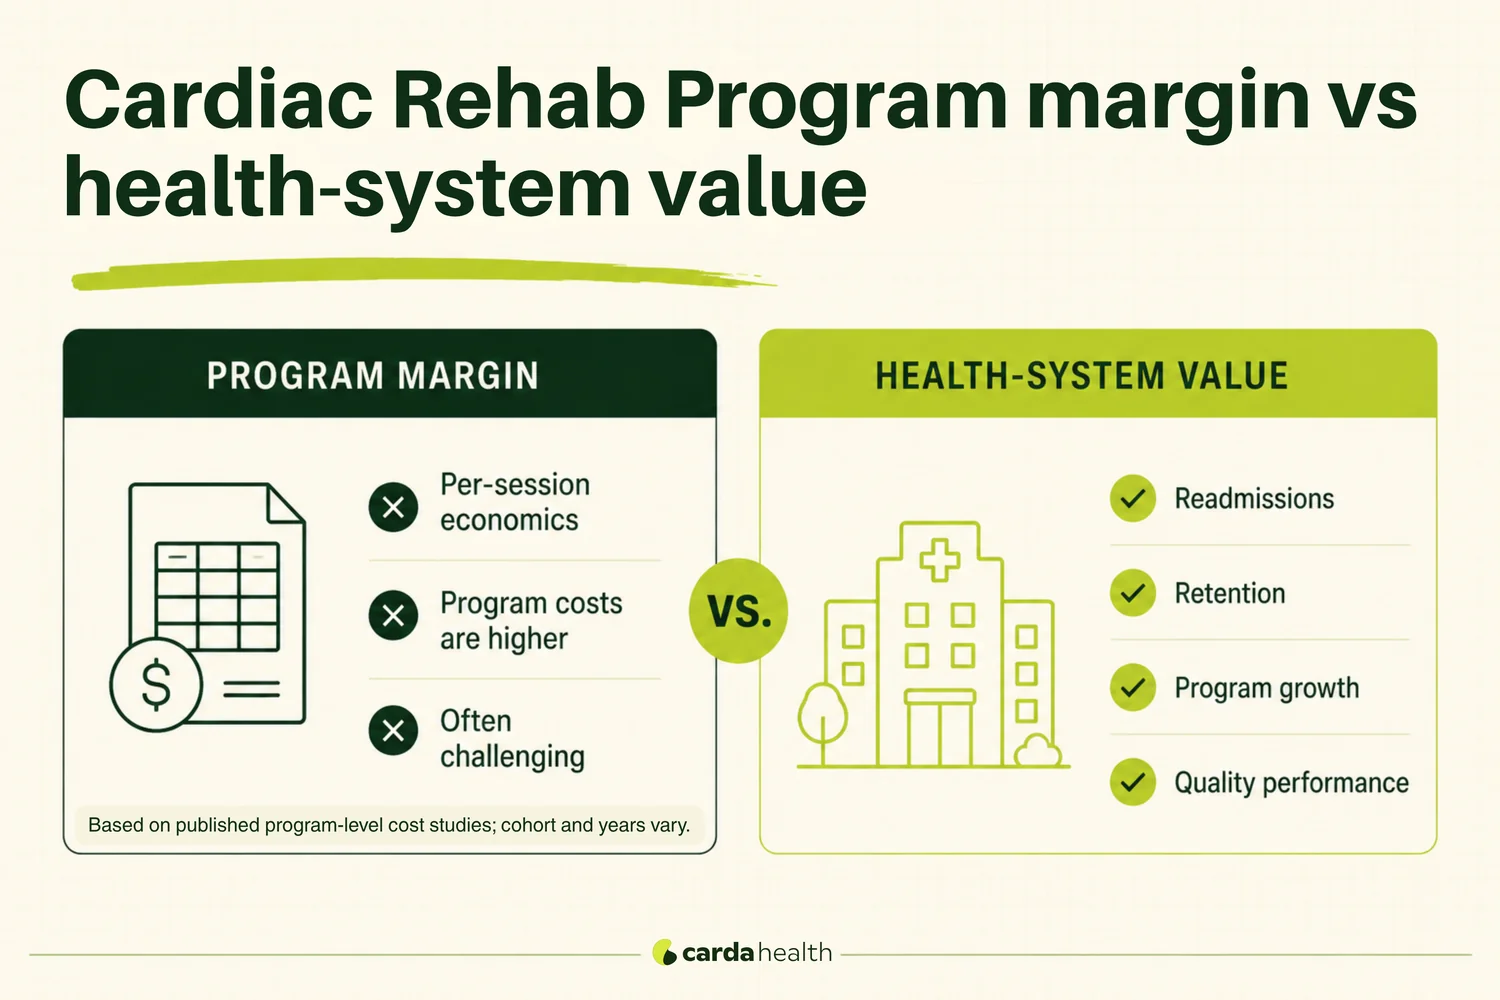
CMS finalized a 2.6% outpatient payment update for 2026, which helps at the margin but does not change the underlying picture. The current national per-session rates for CPT 93797 and 93798 are published in CMS's quarterly OPPS Addendum B, and that is the figure to set against your own fully loaded cost per session. One distinction to hold onto throughout: per-session reimbursement and hospital-wide economics are different ledgers. A service line can lose money per session and still be net positive to the institution through the levers below. Neither figure substitutes for the other.
Why Higher Medicare Payment Has Not Raised Participation
There is a natural assumption that better payment would fix both margin and volume. The evidence complicates that.
In January 2011 the national average Medicare hospital payment for an hour-long cardiac rehab session rose from about $38 to $68, a near-doubling and a sharp break from the incremental rises before it. Payment kept climbing afterwards, to about $104 per session by 2014. An interrupted time series analysis published in Circulation: Cardiovascular Quality and Outcomes tracked what participation did in response.
It did not go up. In the twenty months before the increase, participation among eligible Medicare patients was growing by about 1.1 percentage points a year. No shift appeared when the payment rose. Afterwards the growth flattened, running about 1.3 percentage points a year below the previous trend, for a net trend of −0.2 percentage points a year. The authors are careful about this: the effect was sensitive to the time window and may be a clinically null result rather than a real decline. Either way, it is the opposite of what they expected.
Two explanations they raise are worth carrying into your own planning. The increase may simply have been too small to change how administrators allocate space and staff, since $68 a session still sat close to the cost of delivery. And because traditional Medicare coinsurance scales with reimbursement, raising the hospital's payment also raised the patient's. The authors point to single-center evidence that every $10 increase in copay was associated with 1.5 fewer sessions attended, which would blunt the incentive from the other end.
Newer national data support the point. A 2026 analysis of the AACVPR registry covering 59,838 patients found a smaller per-dollar effect, about 0.5 fewer sessions per $10, but a large effect from having any copay at all: 4.9 fewer sessions attended. Among patients with copays who dropped out and had a recorded dropout reason, 22.9% cited copay issues.
A note on what this study can and cannot show: an interrupted time series establishes association over time, and the authors state plainly that it cannot support causal inference. Read it as evidence that price alone did not move utilization, not as proof that payment is irrelevant. The constraint appears to be referral, access and capacity, which is why a purely financial intervention did not shift the number.
How Much Cardiac Rehab Capacity Does the US Have?
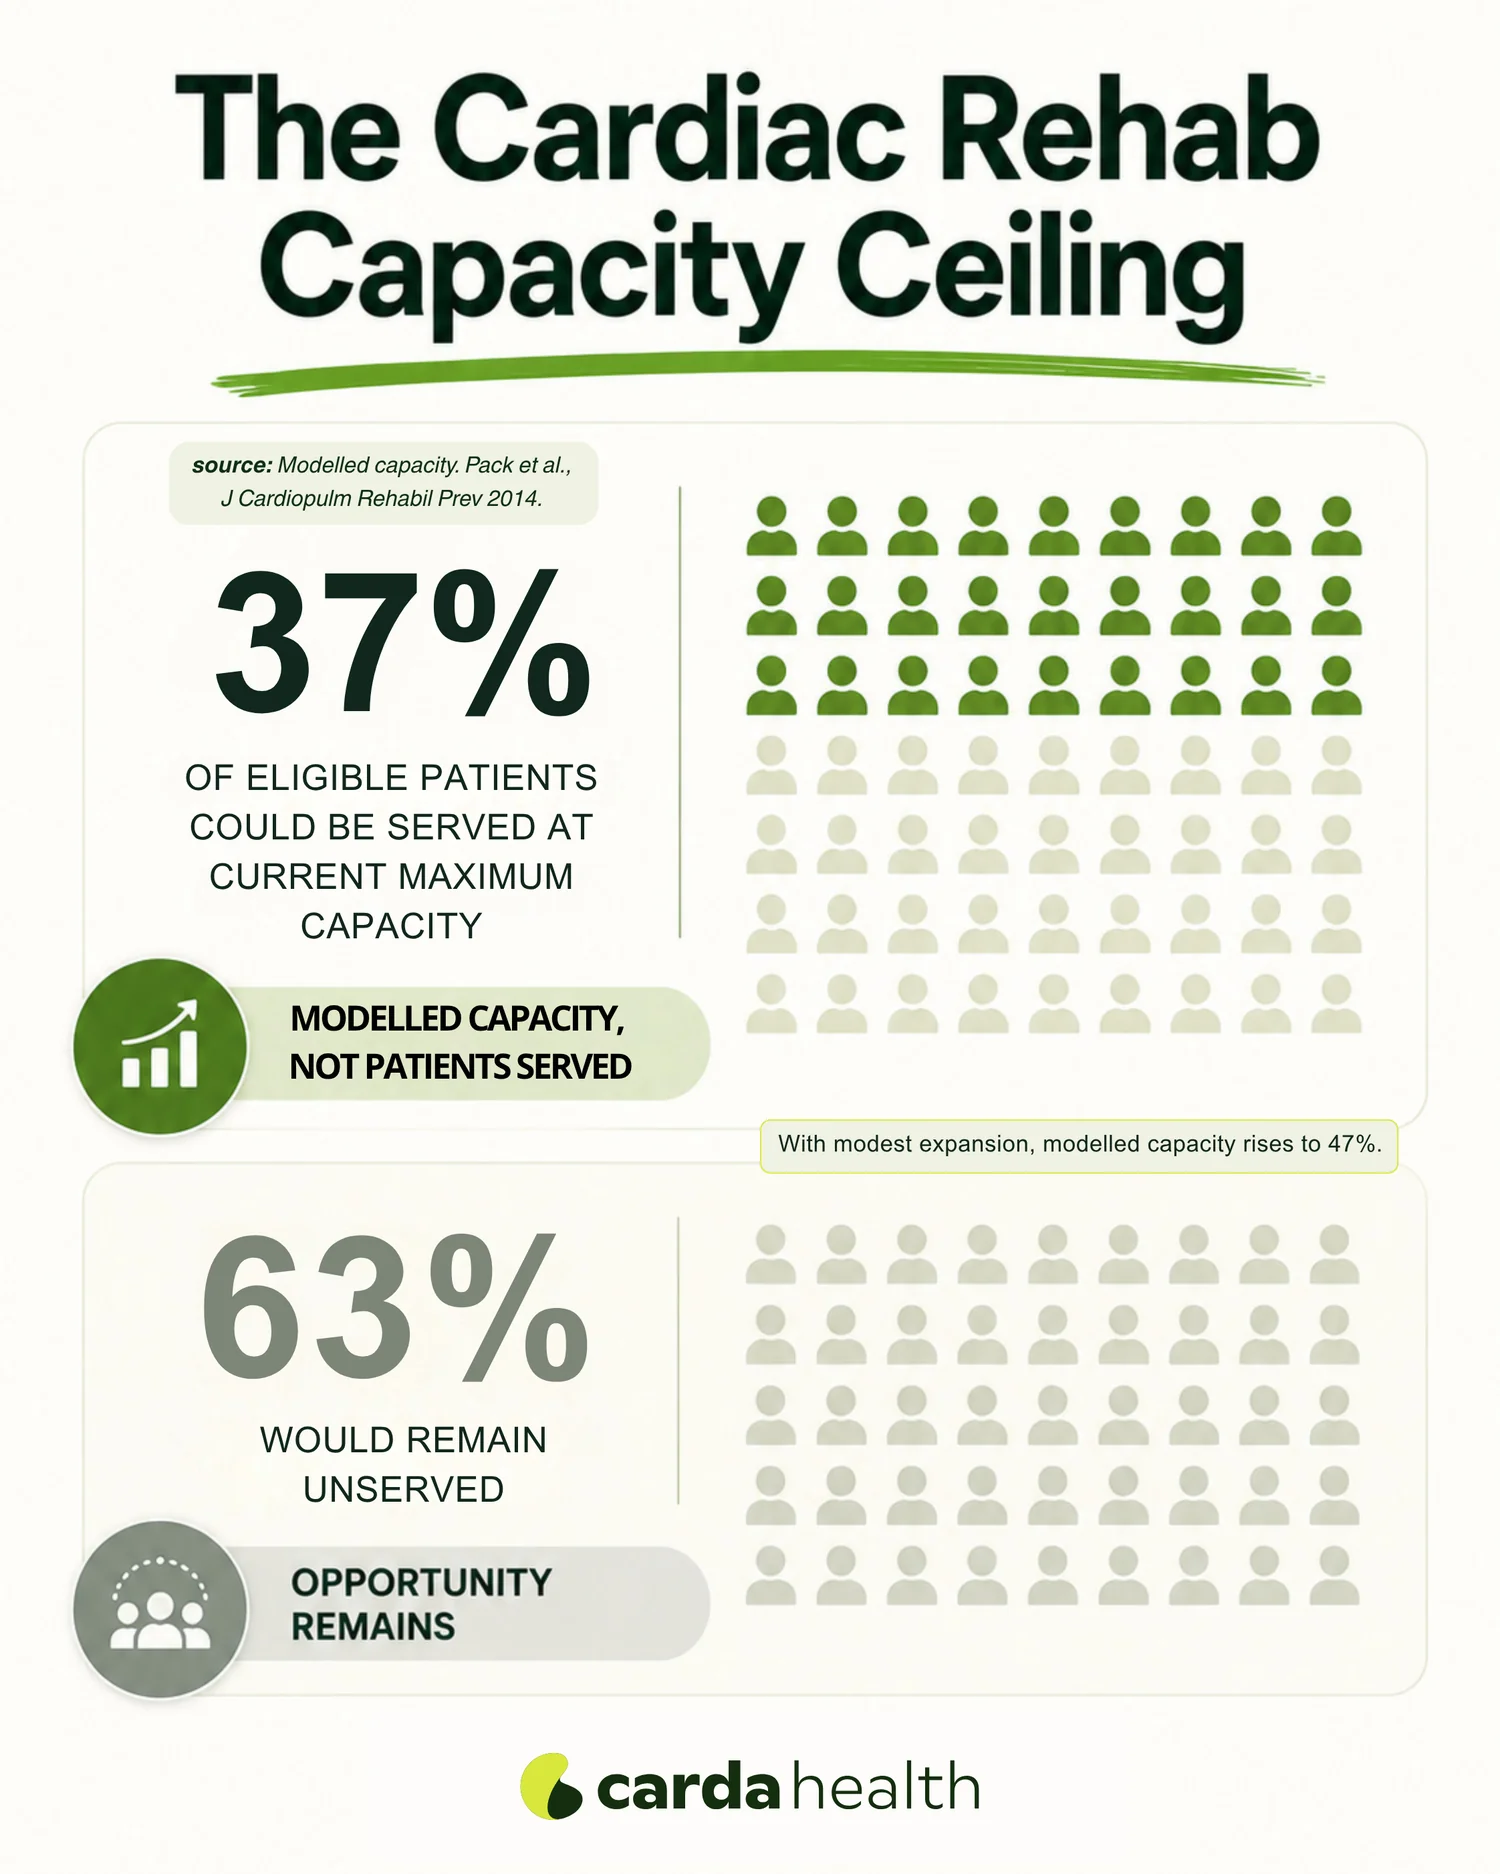
This is the number that should shape strategy. The most recent national estimate comes from a 2012 survey of 812 AACVPR-registered program directors, with 290 responding, published in 2014, which modeled what US programs could absorb. At current maximum capacity they could accommodate about 37% of eligible patients; with modest expansion, about 47%. Both figures describe modeled potential capacity, not patients currently served. Set that against national participation of about one in four eligible patients in 2016 Medicare data and the strategic position becomes clear: the eligible population is large and substantially unserved, and the sector cannot serve it by running existing rooms harder.
No national capacity survey has been published since, so 37% should be read as a 2012 estimate rather than a current ceiling. Newer geographic data show the access gap persists: a 2025 analysis of 3,113 US counties found that the median county had no hospital offering cardiac rehab, and the median distance to the nearest county with one was about 16 miles. That study measures where programs are located, not how many patients they can serve.
For a single service line this translates into a practical dilemma. Growth requires capacity, capacity conventionally requires floor space, equipment, and monitored staffing, and the per-patient economics make that capital hard to justify. That is the dilemma a partnership model is designed to resolve.
Where Cardiac Rehab Creates Value for a Health System
If the value is not in per-session margin, the business case has to be built on the levers that genuinely respond to rehab participation. Five can be evidenced with your own data.
| Value lever | Mechanism | How to evidence it internally |
|---|---|---|
| Readmission penalty exposure | Rehab participation is associated with lower readmissions in four HRRP conditions | Model your current penalty against eligible volume by condition |
| Downstream service line | A 12 to 18 week touchpoint keeps patients engaged with cardiology | Track downstream cardiology encounters among completers vs non-completers |
| Network retention | Patients referred out for rehab may follow that relationship | Measure leakage among patients you cannot currently serve |
| Program breadth | ICR runs up to 72 sessions vs 36 for standard CR; pulmonary adds a second population | Size eligible ICR and pulmonary cohorts separately |
| Quality performance | Referral is a recognized performance measure | Baseline referral rate against your eligible denominator |
HRRP Readmission Penalty Exposure
Four of the six conditions penalized under the Hospital Readmissions Reduction Program are cardiac or pulmonary rehab conditions: heart attack, heart failure, CABG, and COPD. The penalty applies to all Medicare fee-for-service base operating DRG payments for the full fiscal year, up to 3%, so the exposure is measured against total inpatient revenue rather than against rehab volume. This is usually the largest single number in the business case, and it is one finance teams already track. Heart failure is the hardest of the four to move, and our piece on reducing heart failure readmissions explains where rehab does and does not fit in that pathway.
Downstream Service Line and Network Retention
A completed rehab program is a sustained clinical relationship over roughly twelve weeks, during which patients remain connected to your cardiology service. Where you cannot offer rehab, patients are referred elsewhere, and that referral can carry downstream activity with it. This lever is real but institution-specific, so model it with your own data rather than adopting a published figure.
Program Breadth: ICR and Pulmonary Volume
Two structural points affect volume. Intensive cardiac rehabilitation is a separate Medicare benefit permitting up to 72 sessions over 18 weeks against 36 for standard cardiac rehab, and only three ICR programs are approved nationally.
The switch runs one way only. A beneficiary may move once from ICR to CR and keep the remaining sessions, but may not move from CR to ICR at all, so starting a patient on standard CR forecloses ICR for that episode. Separately, pulmonary rehabilitation serves an overlapping referral base, and covering both under one arrangement simplifies contracting and referral logic, as our guide to cardiopulmonary rehabilitation describes. For coverage detail, see our guides to Medicare coverage for cardiac rehab and pulmonary rehab.
What to Model Before Expanding a Cardiac Rehab Program
One frequently cited economic analysis is worth understanding precisely, because it is often quoted out of context. In a study of a virtual cardiac rehab program in a third-party payer environment, only 37% of 7,264 eligible insured patients enrolled in a facility-based program within 12 months, at a mean delivery cost of $2,922 per participating patient. Twelve-month all-cause readmission was 24% among participants against 31% among non-participants, and the average per-patient cost of readmissions was $30,814 per annum.
The authors forecast annual savings of $1 to $9 million from adopting virtual rehab among patients who previously declined. That forecast is from the payer's perspective, not a hospital P&L. It is a strong argument in payer conversations and in value-based arrangements, and a weaker one in a fee-for-service inpatient context. Use it accordingly.
A more recent study measured costs rather than forecasting them. A 2024 retrospective analysis at Geisinger, published in the Journal of the American Heart Association, compared virtual with center-based cardiac rehab and found total allowed costs over the following 12 months about 16% lower in the virtual group, along with lower one-year readmission and emergency department rates and no significant difference in mortality or recurrent heart attack. It reflects one system working with one virtual rehab vendor, and patients were not randomized, so treat it as supporting evidence rather than a forecast for your own population.
A Planning Template for the Business Case
Use the structure below to build the case with your own numbers. It deliberately contains no figures: every input should come from your discharge data, cost accounting, and payer contracts, and each benefit should be assigned to the ledger that actually receives it, so that payer savings are not counted as hospital margin.
| Line item | How to calculate | Whose ledger |
|---|---|---|
| Eligible patients per year | Discharges with a qualifying diagnosis or procedure, by condition | Planning input |
| Expected participants | Eligible patients multiplied by an expected enrollment rate, set separately for each delivery option | Planning input |
| Sessions delivered | Participants multiplied by expected average sessions attended | Planning input |
| Session revenue | Sessions multiplied by per-session payment by payer, from Addendum B and your contracts | Whoever bills: your hospital, or the partner |
| Delivery cost | Sessions multiplied by fully loaded cost per session, or the partner fee | Hospital |
| Patient cost sharing | Copay per session multiplied by sessions; higher cost sharing lowers attendance | Patient |
| Readmission effect | Projected change in condition-specific readmissions, translated by finance into HRRP penalty exposure | Hospital |
| Avoided utilization | Projected reduction in readmissions and emergency visits multiplied by payer cost per event | Payer, or hospital under value-based contracts |
| Downstream activity | Cardiology encounters following completion, measured in your own data | Hospital |
Questions for Your Finance Partner
- What is our eligible population by condition, and what share do we currently serve?
- What is our current HRRP payment adjustment, and what is 0.1% of a year of Medicare inpatient revenue worth to us?
- What does a marginal cardiac rehab patient cost us to serve today, fully loaded?
- How much downstream cardiology activity follows a completed program in our own data?
- Under a partnership, who bills, who bears denial risk, and how is that reconciled?
- What proportion of our eligible population lives outside a reasonable drive of our sites?
- Which parts of our plan depend on the in-home virtual delivery provision that expires December 31, 2027?
Where Carda Health Fits
For systems that conclude the answer is added capacity without capital, Carda Health delivers live one-to-one sessions supervised by a clinical exercise physiologist with real-time vitals monitoring in the patient's home, ships the required equipment to the patient, and verifies eligibility and handles much of the enrollment and coverage paperwork after referral.
The value levers above depend on completion rather than enrollment, so ask any partner for its completion rate with the denominator, threshold and cohort attached, and put the reporting commitment in the contract. Carda Health covers both cardiac and pulmonary populations and is the exclusive provider of Ornish program delivered entirely online, one of only three ICR programs approved nationally. As with any partner, the right approach is to test those claims against your own population and put the material ones in the contract.
The Bottom Line
Whether expansion pays on a per-session basis depends on your local costs, reimbursement, payer mix, and volume, and the published evidence gives no reason to assume it will, so build the case on more than session contribution. The defensible case is that a large eligible population goes unserved, that the most recent national estimate found existing capacity could not close the gap, and that the value accrues through readmission exposure, downstream service line activity, and program breadth.
Once framed that way, the question becomes how to add capacity at the lowest capital intensity, and a partnership model answers it directly. Model your own numbers, insist on completion data rather than enrollment data, and be clear about whose ledger each benefit lands on.
See how Carda Health partners with health systems
Frequently Asked Questions
Is cardiac rehab profitable for hospitals?
The published evidence shows per-session economics have historically been difficult, though there is no recent national measure, and results for any one program depend on its local costs, reimbursement, payer mix, and volume. A 2009 costing study found its three traditional cardiac rehab programs costing about $1,828 per patient against roughly $683 in Medicare-allowed charges, and a later single-program microcosting analysis found the mean margin per participant moving from a $62 surplus before the pandemic to a $421 deficit during it, with none of the underlying differences reaching statistical significance. The case for expansion generally rests on service line and quality economics rather than per-session contribution.
Would higher reimbursement solve the participation problem?
The evidence suggests not on its own. In 2011 Medicare's national average hospital payment per session nearly doubled, from about $38 to $68, and an interrupted time series analysis found no associated increase in participation among eligible beneficiaries. Payment kept rising afterwards, to about $104 per session by 2014, with annual outpatient updates since, including 2.6% for 2026. Referral, access and capacity appear to constrain utilization more than price does, and rising reimbursement also raises patient coinsurance, which may offset part of the incentive.
How much capacity does the sector actually have?
Less than the need. The most recent national estimate, from a 2012 survey of program directors published in 2014, modeled that US programs could accommodate about 37% of eligible patients at current maximum capacity, rising to about 47% with modest expansion. These are 2012 modeled ceilings, not current utilization or a current capacity measure, and no national capacity survey has been published since. Participation in 2016 Medicare data was about one in four eligible patients.
How do we expand cardiac rehab capacity without building space?
Partnering with a virtual or home-based provider adds capacity without floor space, equipment, or additional monitored staffing, and is not constrained to a single site. It substitutes vendor and integration risk for capital risk, so partner selection and referral integration become the critical variables. Until December 31, 2027, hospital programs can also deliver sessions to patients at home by real-time audio-video under the Consolidated Appropriations Act, 2026.
What is the business case for outsourced or virtual cardiac rehab?
Serving a larger share of an eligible population you currently cannot reach, with value accruing through readmission penalty exposure across four HRRP conditions, downstream cardiology activity, retention of patients in network, and access to intensive cardiac rehab and pulmonary volume. Model each against your own data.
References
- Lee AJ, Shepard DS. Costs of Cardiac Rehabilitation and Enhanced Lifestyle Modification Programs. J Cardiopulm Rehabil Prev. 2009;29(6):348–357.
- Fletcher DR, Grunwald GK, Battaglia C, Ho PM, Lindrooth RC, Peterson PN. Association Between Increased Hospital Reimbursement for Cardiac Rehabilitation and Utilization of Cardiac Rehabilitation by Medicare Beneficiaries: An Interrupted Time Series. Circ Cardiovasc Qual Outcomes. 2021;14(3):e006572.
- Harzand A, Weidman AC, Rayl KR, et al. Retrospective Analysis and Forecasted Economic Impact of a Virtual Cardiac Rehabilitation Program in a Third-Party Payer Environment. Front Digit Health. 2021;3:678009.
- Pack QR, Squires RW, Lopez-Jimenez F, et al. The current and potential capacity for cardiac rehabilitation utilization in the United States. J Cardiopulm Rehabil Prev. 2014;34(5):318–326.
- Ritchey MD, Maresh S, McNeely J, et al. Tracking Cardiac Rehabilitation Participation and Completion Among Medicare Beneficiaries to Inform the Efforts of a National Initiative. Circ Cardiovasc Qual Outcomes. 2020;13(1):e005902.
- Bricker Graydon. CMS cuts CY 2018 payment rates to non-excepted off-campus provider-based departments. November 2017.
- American College of Cardiology. CMS Releases 2026 Hospital OPPS Final Rule. November 2025.
- Shah ND, et al. Retrospective Comparison of Outcomes and Cost of Virtual Versus Center-Based Cardiac Rehabilitation Programs. J Am Heart Assoc. 2024.
- Thapa S, Naser M, Farah M, et al. Association Between Copayments and Attendance in Cardiac Rehabilitation: A Nationwide Analysis From the AACVPR Registry. J Am Heart Assoc. 2026;15(7):e049082.
- Chen EW, Wu WC, Han L, et al. Disparities in Geographic Access to Cardiac Rehabilitation Among Socially Vulnerable Communities. J Am Heart Assoc. 2025;14(20):e040815.
- Centers for Medicare & Medicaid Services. Virtual Cardiac Rehabilitation (CR), Intensive Cardiac Rehabilitation (ICR) and Pulmonary Rehabilitation (PR) Furnished by Hospital Outpatient Departments (HOPDs) FAQ. April 9, 2026.
- Melbostad HS, Savage PD, Mahoney K, Gaalema DE, Ades PA, Shepard DS. Financial Analysis of Cardiac Rehabilitation and the Impact of COVID-19. J Cardiopulm Rehabil Prev. 2021;41(5):308–314.